
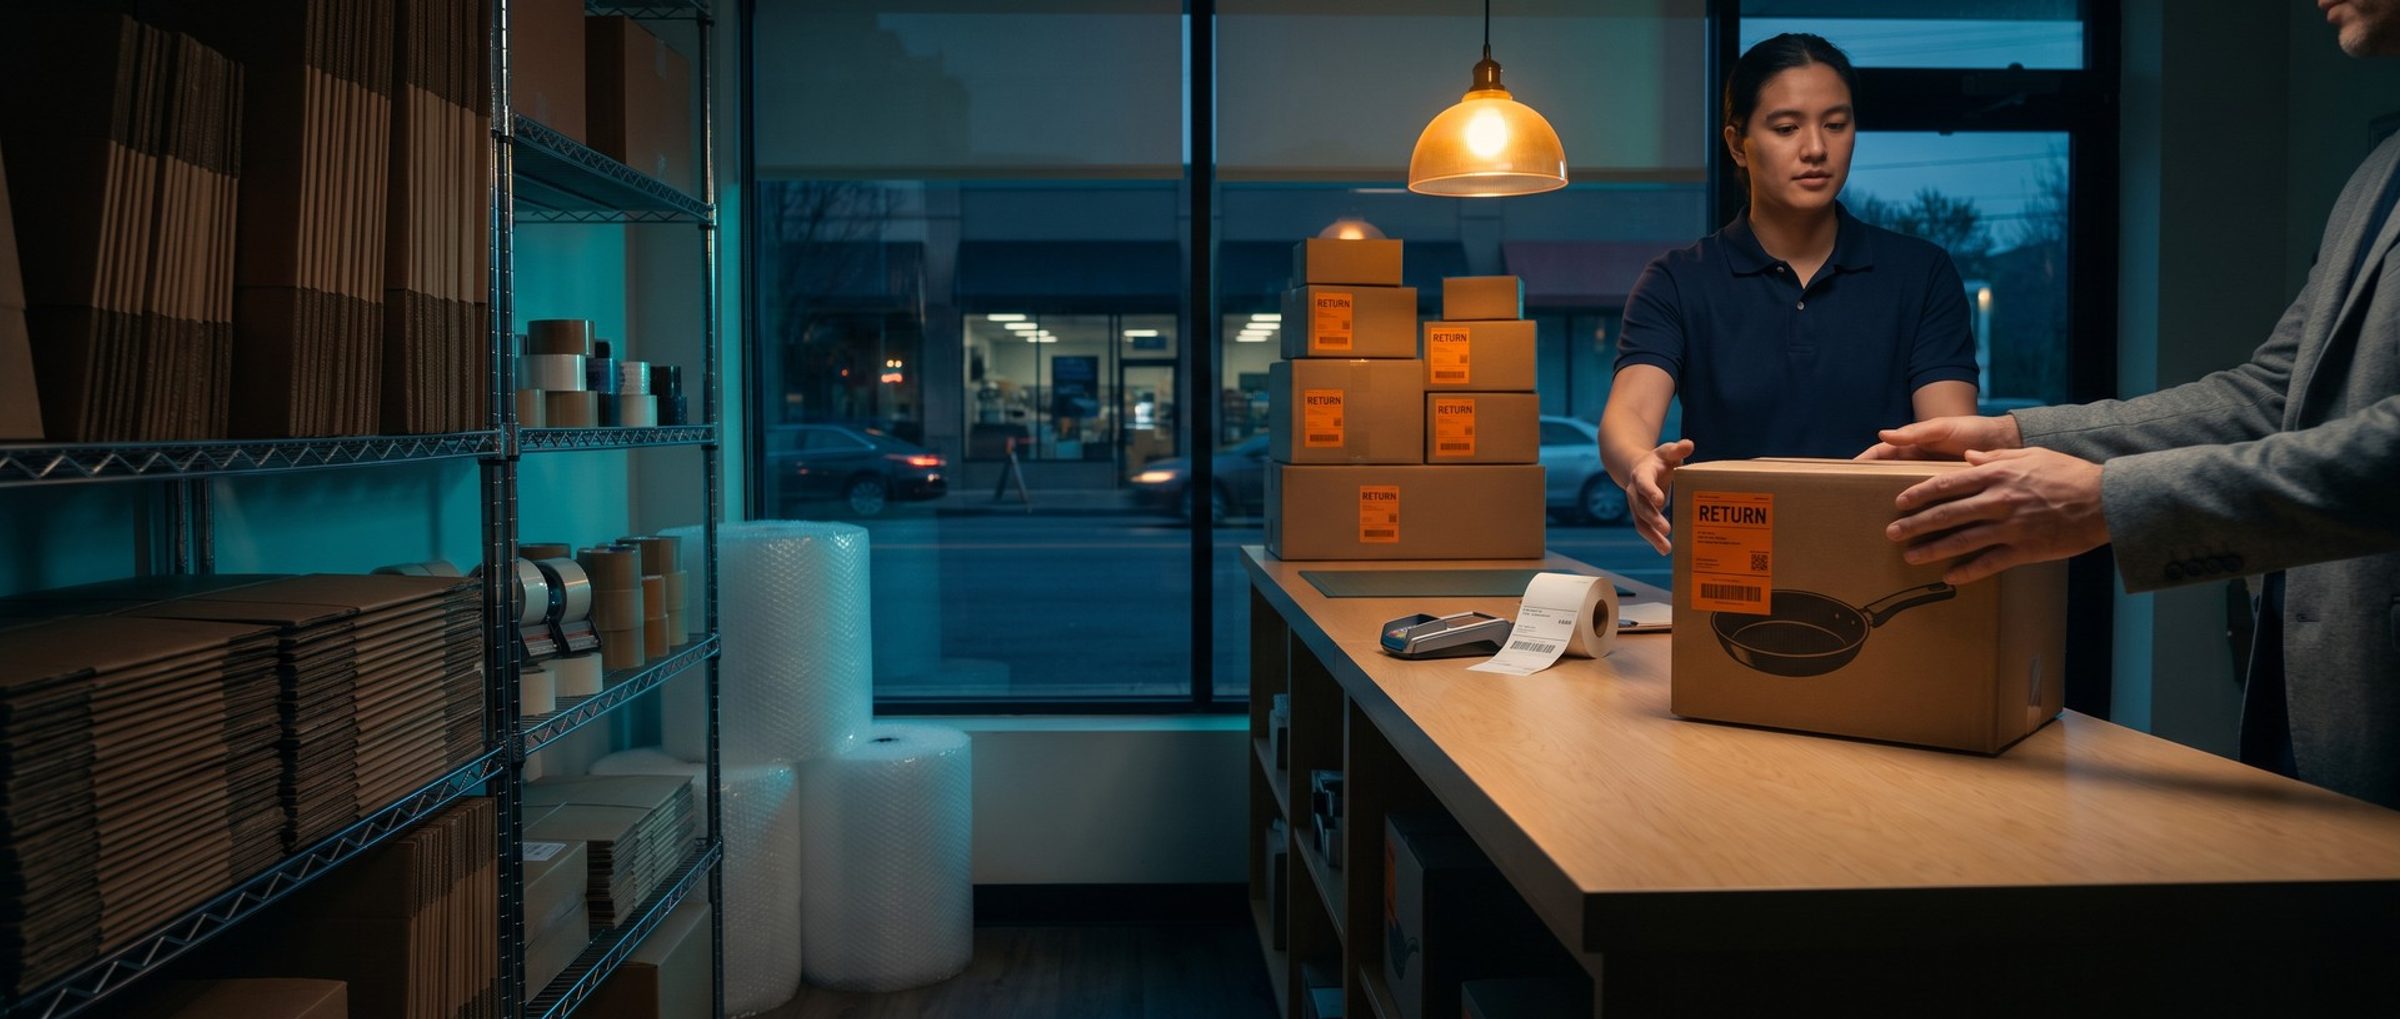
The math most store owners use for ad profitability fits on a napkin. If a product sells at a 50% margin, every dollar of ads that brings back two dollars of sales pays for itself. A return on ad spend, or ROAS, of 2.0 is break-even, and anything above it is profit.
The napkin leaves things out. It leaves out the box, the label, the card processor, and the customer who sends the order back. Count those, and the same store with the same 50% margin needs a ROAS somewhere north of 4 just to stay even. Run at 3.0 because the napkin said that was comfortable, and the account loses money on average while the dashboard looks healthy.
Below, that number gets built one cost at a time, with prices and return policies from the twelve US stores in this guide and Shopify's published card rate. Then it works backward to what a click can cost and what a first budget needs to be. Your margin and costs will differ. Swap them in; the method is the same.
Google Ads Divides Revenue by Ad Spend. That Number Never Sees Your Shipping Bill.
ROAS in Google Ads is simple: conversion value divided by cost. Spend $1,000, record $3,000 in purchase value, and the account shows 3.0.
Break-even ROAS is one divided by the share of each sale you actually keep after the costs that grow with the order. That share is where the napkin goes wrong. Gross margin covers what you paid for the product. It doesn't cover what it costs to get the product to the customer and keep it there.
Look at the free shipping offers in our example stores. The cookware brands ship free above roughly $90 to $100. The coffee roasters ship free above $40 to $60. Every order over those thresholds carries a shipping bill the customer never sees and the ad account never counts. Add card processing on every sale and the cost of returns, and the share you keep shrinks fast.
The Same $100 Order That Breaks Even at 2.0 on Paper Needs About 4.3 Once Every Cost Comes Out.
Here's one $100 order, built step by step. Each input is either sourced or marked as our assumption, so you can replace it with your own.
- Product cost: $50. A 50% gross margin, in line with the 51.04% NYU Stern's sector data shows for US household products companies as of January 2026. Those are large public companies, not small online stores, so treat it as a reasonable starting point, not a benchmark.
- Shipping and packing: $12. Our assumption. Replace it with your real average.
- Card processing: $3.20. Shopify Payments' standard online rate is 2.9% plus 30 cents.
That leaves $34.80 of every $100, so break-even ROAS is already about 2.9, not 2.0.
Now returns. The National Retail Federation and Happy Returns estimated that 19.3% of online sales would be returned in 2025. Apply that rate. Of every $100 the ad account reports, about $80.70 stays sold and keeps its $34.80-per-hundred contribution, roughly $28.08. On the $19.30 that comes back, the store has already paid outbound shipping, pays to handle the return (we assume $10 per return), and in this example doesn't get the card fee back. We also assume the returned item goes back into stock; if it can't be resold, the hit is bigger. That costs about $4.86.
What's left: about $23.22 for every $100 of revenue Google Ads reports. Break-even ROAS: about 4.31.
A store with a fatter margin, lighter products or fewer returns will land lower. A store selling bulky items with free shipping and a liberal return policy will land higher. Run your own numbers before you set a single target. If you added cost of goods to your Merchant Center feed and send cart data with each purchase, as Chapter 1 described, Google Ads will report gross profit by product, which lets you check this receipt against real orders. Most of them are already in your store's reports: average shipping cost per order from your shipping app or carrier invoices, your processor's actual fee rate from a month of payouts, and your return rate from the last six months of refunds divided by orders.
A Returned Order Costs the Store Twice: the Refund and the Shipping It Never Gets Back.
Returns don't hit every category equally, and our e-bike stores show why some store owners treat them as a line item of their own. Aventon charges $125 for return shipping on a bike and a 50% restocking fee on a used one. Ride1Up deducts $250 to $350 from the refund to cover the return label. Those policies exist because a returned e-bike costs the store real money even when the customer pays part of it.
There's a second problem, and it's in the ad account. As Chapter 1 covered, Google lets bidding hear about a refund only if you adjust the purchase within 7 days of it being recorded. A bike that comes back on day 20 can still be corrected in your reports, but bidding already learned from it as a full sale.
That's why the ROAS your account reports is a ceiling, not a fact. If a fifth of your orders come back, a reported 4.3 only breaks even. Our conversion tracking chapter shows how to send refunds back while bidding can still use them.
At 1.4% Conversion, $1 Clicks Cost About $71 per Order. A $125 Pan Can't Pay That Back.
Now work backward from the click. The chain runs: cost per click, conversion rate, cost per order, order value, ROAS.
Take an illustration: clicks that cost $1. Littledata's benchmark of 2,800 Shopify stores put the average conversion rate at 1.4%, which means about 71 clicks per order and about $71 in ad spend for each sale.
Put that against a single pan. Caraway's fry pan sells for $125. One pan per order at $71 of ad spend is a ROAS of about 1.75. At the 23.22% the store keeps from the receipt above, the pan leaves about $29 to cover $71 of ads.
Better conversion helps but doesn't close the gap. Dynamic Yield reports a 2.71% global average. Those same $1 clicks then buy an order for roughly $37, which works out near 3.4. Closer, and still short of 4.3.
Two things change the math. Order value is the first: the same cookware brands sell sets from $445 to $855, and a set order pays for many more clicks than a single pan. The other is what a customer is worth after the first order.
One caution on click prices. Keyword Planner puts "carbon steel pan" somewhere between 34 cents and a dollar fifty. That spread is Keyword Planner's estimate of top-of-page bids, and it says little about what your own clicks will run. Use your own cost per click once the account has run, and treat early numbers as a rough guide.
A Coffee Subscriber Isn't One Order. Repeat Purchases Decide How Much the First Sale Can Lose.
A $25 bag of coffee has the same break-even math as a pan, with a smaller order. On its own, the first bag rarely pays for the ad that sold it. The second, fifth and twentieth bags change everything, which is why our coffee stores push subscriptions so hard. Volcanica takes 20% off the first subscription order and 10% after. Onyx offers 5% to subscribers.
Retention numbers are worth knowing, as long as you remember whose they are. Bluecore, a retail marketing vendor, tracked customer retention across seven retail categories and found a 27.4% overall rate. That's a vendor's own data, not a neutral sample of online stores.
Here's the rule we use. A store can accept a first-order ROAS below break-even only when its own order history shows customers coming back, and only by about as much as those repeat orders reliably earn. A coffee store with a year of subscription data can make that call. A store selling one $1,299 e-bike per customer shouldn't count on a second sale.
Broad Match Waits for About 30 Sales a Month. At $71 an Order, Getting There Costs About $2,100.
The last question is budget, and it starts with the same gate the rest of this guide uses. A new account opens with exact match and hand-set bids. In our method, broad match and Google's automated bidding wait until the account records about 30 purchases a month. That's our gate, set higher than Google's own minimums, so the automation starts with enough real orders to learn from.
So a first budget should be able to buy those 30 sales. In the illustration above, at $71 an order, that's about $2,100 a month in ad spend. At 2.71% conversion it's closer to $1,100. Neither number is a target. Both are a way to check whether a budget can reach the gate at all, or whether it will sit below it for months.
Start lower than that, with a budget that lets you read real bid estimates and costs, then raise it as the numbers come in.
Next: Ad Rank Rewards the Page That Matches the Search, Not the Biggest Bid.
You know what a click can cost before it loses money. Chapter 4 looks at the other side of the auction: how Google decides who shows and what you pay, and why a category page that matches the search beats a bigger bid.
If you're starting from scratch, Chapter 2 covers which searches deserve the first dollar. Every chapter is on the guide's home page.
Before we raise a budget for a store we manage through Google Ads management, we build this receipt with the owner's real costs. Doing it yourself? Put your own shipping, fees and return rate into the $100 example above. The number at the bottom is the ROAS your account has to beat.