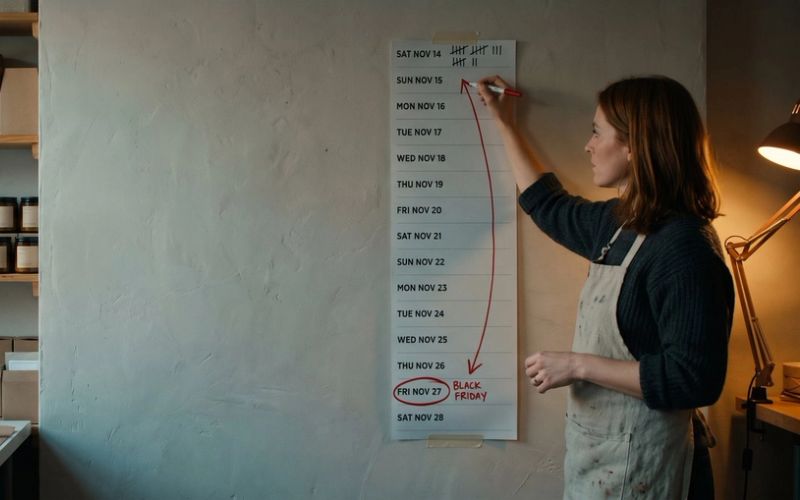

The short answer: there is no right percentage, and the percentages you will find online come from businesses that look nothing like yours. A small online store should set its marketing budget one month at a time, from its own numbers. Start with what repeat customers will spend anyway, add the sales your promotions will create, and then decide how many ad dollars each month can carry before the next dollar stops paying for itself. Add up the twelve months and that is your budget. The percent of sales falls out at the end. You never start with it.
It usually goes the other way. Some time in November, between Black Friday prep and a full inbox, an owner decides next year's marketing will be 10 percent of sales. They divide by twelve and spend the same amount every month. By March the slow months have eaten money that sold very little, and by December the busiest weeks of the year are running on the same budget as February.
This article walks through the month-by-month version instead. It is the method planning teams at large online brands use, cut down to what a store doing a few hundred thousand dollars a year can do in an afternoon with a spreadsheet and its Shopify reports. At the end we put a whole year on one page for a store that sold $600,000 last year, so you can see every number.
The Percent-of-Sales Rule Comes From Companies a Thousand Times Your Size
When people quote a marketing budget percentage, the number usually traces back to one of two places.
The first is Gartner's annual survey of chief marketing officers. Its 2026 edition, published in May, puts the average marketing budget at 7.8 percent of company revenue, up from 7.7 percent the year before. It surveyed 401 marketing leaders, and Gartner says the vast majority of them work at companies with more than $1 billion in annual revenue. That budget covers salaries, agencies, software and research as well as ads. In the 2025 survey, paid media was only 30.6 percent of it, about 2.4 percent of revenue. A billion-dollar company's marketing department is not a useful model for a store with two employees and a warehouse in the garage.
The second is advice aimed at small businesses, and it is all over the place. A 2019 post on the U.S. Small Business Administration's blog says plainly that there is no hard and fast answer, then quotes figures from other sources ranging from about 1 percent of revenue spent on advertising (about 4 percent for retailers) to nearly 10 percent of revenue for companies selling products to consumers. Those are averages across every kind of business, some of which barely advertise at all.
Even if the percentage were right on average, it would still be wrong for you, for two reasons.
It ignores your margin. A store that keeps 70 cents of every dollar after product, shipping and card fees can pay far more to win a customer than a store that keeps 25 cents. The same 10 percent rule gives them the same budget. One is underspending and the other is losing money on every order the ads bring in. If you have not worked out your own line yet, we walk through it in Your Ads Report a 3x Return. At a 30% Margin, Every One of Those Orders Lost Money.
It ignores the calendar. A flat percentage spread evenly assumes every month can use money equally well. No store works that way, and we will put numbers on it below.
Ad spend as a share of sales is still worth watching, as a warning light rather than a target. If it creeps toward a third of your revenue, something is wrong, and Scaling an Ecommerce Store Stops Paying When the Next New Customer Costs More Than Their First Order Earns shows how to find out what. But it is a result you check at the end of the plan, not the number you start from.
Repeat Customers Are the Part of Next Year You Can Already Predict
Before you think about ads at all, split last year's sales into two piles: money from customers who had bought before, and money from first-time buyers. These two piles behave very differently, and mixing them is the most common reason a forecast goes wrong.
Shopify will do the split for you. The New vs returning customers report shows first-time and returning customers side by side, and you can group it by month. Shopify's analytics also has a Total sales (returning) figure, which is the dollar amount returning customers spent. Pull both for the last twelve months and put them in a spreadsheet with one row per month.
Repeat sales are the steadiest number you have. These people already know your store, already have an account or an email in your list, and tend to buy on a rhythm: a refill every couple of months, a gift every December. Shopify's own help pages note that most stores show a returning customer rate between 20 and 40 percent. Whatever yours is, last year's repeat sales by month, adjusted a little for the customers you added this year, is a reasonable first guess for next year. If you grew your customer base by 10 percent this year and kept roughly the same share of them coming back, repeat sales growing somewhere in single digits is a sensible starting point.
New-customer sales are the opposite. Nobody owes you a first order. If you stop advertising, stop posting and stop launching, that pile shrinks fast. The planners at large brands say the same thing: returning revenue is far easier to forecast than new revenue, and their misses on new customers are consistently wider. That is useful to know before you start, because it tells you where to put your caution. The ad budget's whole job is to buy the uncertain pile. The steady pile is what you lean on when you plan inventory and cash.
Your Promo Calendar Decides When the Money Arrives
Here is the step most budgets skip, and it is the one that makes the biggest difference to timing. Your sales do not arrive smoothly. They arrive when you do something: send an email, open a sale, launch a product, get a mention somewhere. The calendar of what you did last year explains most of the bumps in last year's sales, and the calendar of what you plan to do next year is the best forecast of next year's bumps you will get.
So go back through the year and write it down. You do not need special software for this:
- Open your email platform and list every campaign you sent, with the date.
- List every sale and discount, with start and end dates. Your Shopify discount report has the codes and when they were used.
- List every launch, restock and new collection.
- List anything unusual: a press mention, an influencer post, a shipping delay, a site outage.
- Put it all next to your daily sales and look at what happened on those days, split into new and returning customers.
You will start to see patterns. Maybe your spring launch email brings in about $4,000 of extra sales, mostly from repeat customers. Maybe a sitewide sale brings in more first-time buyers than you expected. Tag each event by type (sale, launch, email, outside mention) so you can say what a typical one of each is worth.
Then lay next year's calendar over the twelve months. Which launches are planned? When is the early-access list for Black Friday going out? Are you running an after-Christmas sale this year? We make the case for that one in Should Your Store Run an After-Christmas Sale? Each planned event gets a rough dollar value based on what similar ones did last year.
This is also where the budget conversation and the marketing conversation become the same conversation. If your Black Friday plan depends on a bigger email list, that list has to be built in September and October, and the ad money to build it has to be in those months' budgets. We wrote about that timing in Black Friday Is Won in September, Not November.
December Can Absorb More Ad Spend Than February. Give Every Month Its Own Budget.
Online shopping is seasonal for everybody, and much more seasonal for some stores than others. Census Bureau data for U.S. nonstore retailers in 2025 (the category that is mostly online sellers), not adjusted for the season, shows December alone was 10.9 percent of the year's sales, while February was 7.3 percent. December sold about one and a half times what February did, and November and December together were a fifth of the year. That is the average across all of online retail. A store selling gifts, swimwear or anything tied to one season can swing far harder.
More shoppers in a month means the same ad dollar finds more buyers. So the question for each month is not "what is my budget?" but "how much can this month carry before the extra dollars stop paying?"
You can answer that from last year, with one number per month: new-customer sales divided by ad spend. Take Shopify's new-customer sales for the month (total sales minus the returning figure) and divide it by what you spent on ads across every platform that month. This is not the return your ad platforms report. It counts every first-time buyer, including the ones who found you some other way, and it uses your store's numbers rather than Google's or Meta's. That makes it rougher but harder to fool yourself with.
Two numbers decide what to do with it.
The first is your break-even line. If you keep 40 cents of every dollar on a first order after product, shipping, packaging and card fees, then an ad dollar has to bring back at least $2.50 of first-order sales to pay for itself. That is your line, and it comes from your margin, not from anyone's benchmark. You can choose to pay more than a first order earns if customers reliably come back, but then a bill that arrives this month is being paid by money that arrives next year, which is the trap in Lifetime Value Does Not Pay This Month's Invoice.
The second is what the next dollar brings back, not the average one. The average flatters you, because the first dollars in a month find the easiest buyers. If last December you spent $5,000 and new-customer sales came to $42,500, the average was $8.50 per ad dollar. The tenth thousand you add will not do that well. Without a test of your own, a cautious working assumption is that extra dollars bring back about half the month's average. That puts an extra December dollar at about $4.25, comfortably above a $2.50 line, and an extra February dollar (where the average was $5.70) at about $2.85, barely above it.
So the plan moves money toward the months where the next dollar works hardest and away from the months where it barely pays. You check the assumption as you go, which is the last section of this article. If you raise a month's budget and the extra new-customer sales divided by the extra spend comes in under your line, that month has hit its ceiling. The full method for that test is in the scaling article linked above.
One more thing changes in the busy months: the price of attention. Ad costs on Meta rise in the fourth quarter because every retailer is bidding for the same people, which we covered in Meta Ads Get More Expensive in Q4. Plan For It Now. That is already baked into last year's December numbers, which is one more reason to plan each month from its own history rather than from a yearly average.
One Sales Forecast Is a Guess. Plan for a Bad Year, a Likely One and a Great One.
A single forecast number creates a bad choice. Make it cautious and your team has nothing to aim for. Make it ambitious and you buy inventory and commit cash against sales that may never come. The answer large brands use is to stop pretending one number can do both jobs and write down three.
The bad year is the lowest outcome you would honestly expect. Repeat customers come back at last year's level and no better, your promotions do half what last year's did, and extra ad dollars bring back less than you hoped. This is the number you make sure the business can survive. If you have a bank line or a lender who sees your plan, this is the number they see, because the point is to promise something you will beat.
The likely year is the one you actually think will happen, built from the three layers above with your honest assumptions. This is the number you plan cash and inventory against. Order stock for the likely year, not the great one. Inventory bought for sales that do not arrive is cash sitting on a shelf, which we went through in detail in You Did Not Lose the Money. You Turned It Into Inventory.
The great year is the stretch goal. Promotions land, repeat customers come back more often and the extra ad dollars do better than your cautious assumption. This is the number you share with your team and chase. It also tells you how much extra ad spend you would be willing to add, and the rule for releasing it is simple: you only spend toward the great year when a month is actually running ahead of the likely plan.
A warning from the people who do this for a living: start from what your numbers say will happen, not from the number you want. If you start with "we need to grow 30 percent" and adjust the assumptions until the spreadsheet agrees, you end up with a plan that misses every month and a team that stops believing it. Build the likely year from the data first. Then decide what you would have to change to reach the great year, and write those changes down as actual projects with dates.
An Ad Budget You Check Once a Year Is a Wish. Open the Spreadsheet Every Monday.
The forecast is only worth the effort if you look at it. Once the year starts, put a weekly check on the calendar, every Monday, and compare what happened to what the plan said.
Divide each month's likely sales by its number of days to get a daily target, and add them up by week. Then compare three things, separately:
- Repeat sales against plan. If these are behind, the problem is usually your list or your calendar: an email that underperformed, a launch that slipped, a flow that stopped sending.
- New-customer sales against plan. If these are behind while repeat sales are on track, the ads are the place to look: the creative is tired, the offer is weak, or a campaign is spending on the wrong people.
- Ad spend against plan. If you are spending more than planned and new-customer sales are not keeping up, you are past that month's ceiling. Pull back to the plan.
The point of splitting it this way is speed. A store that only looks at total sales finds out at the end of the month that something went wrong, and has to guess what. A store that looks at the three lines every week knows within days which part missed and can fix it inside the month: resend the email to the people who did not open it, extend a promotion that is working, refresh the ads, or move budget between Google Ads and Meta toward whichever is bringing in first-time buyers more cheaply this month.
Watch the calendar too. A month that starts on a Thursday or Friday gives you a weekend before most people look at anything, and a week can be gone before anyone notices a slow start. If a promotion launches on the first of the month, check it on the second.
When a month runs ahead of plan, that is your signal to release some of the great-year spend, a little at a time, and check whether the extra dollars still clear your break-even line. When a month runs behind, do not wait for next month to fix it.
A $600,000 Store's Whole Year of Ad Spend Fits on One Page. Yours Can Too.
Here is the whole method on one store. The store is made up, but the shape of its year follows the Census pattern for U.S. online retail described above.
Last year: $600,000 in sales. 35 percent, or $210,000, came from repeat customers, and $390,000 from first-time buyers. The owner spent $5,000 a month on ads, $60,000 for the year. The store keeps 40 cents of every first-order dollar after product, shipping and fees, so its break-even line is $2.50 of new-customer sales per ad dollar.
Dividing each month's new-customer sales by its $5,000 of ad spend shows how uneven the year really was. February brought back $5.70 per ad dollar. November brought back $7.30 and December $8.50. The same flat budget was overspent in the slowest month and underspent in the two busiest.
Step 1, repeat sales. Last year's repeat sales by month, plus 8 percent for the larger customer base: $226,600.
Step 2, the calendar. Three things are new this year: a spring launch in March worth about $4,000, a bigger early-access list for Black Friday worth about $8,000 in November, and a first after-Christmas sale worth about $4,000 in December. That is $16,000 on top of last year's pattern.
Step 3, the monthly ad budget. The owner raises the total only slightly, to $65,000, and moves it toward the months where the next dollar works hardest:
- February: $3,500
- January, March, April, June, August and September: $4,500 each
- May: $5,000
- July: $5,500
- October: $6,000
- November: $8,000
- December: $10,000
Using the cautious rule that extra dollars bring back half the month's average, and that the dollars cut from a month were earning half its average too, new-customer sales come to about $413,600. The same $65,000 spread evenly across the year would bring in about $406,300. Moving the money is worth about $7,300 in sales before spending a dollar more. It is not a miracle. It is just free.
Step 4, the three years.
- Bad year: repeat sales flat at $210,000, promotions at half value, extra ad dollars bringing back a third of the average. About $624,000, up 4 percent.
- Likely year: the plan above. About $656,000, up 9 percent.
- Great year: repeat sales up 12 percent and extra ad dollars bringing back two-thirds of the average. About $672,000, up 12 percent, before any extra spend is released.
Step 5, the weekly check. In November the likely plan is $76,300 of sales, about $17,800 a week. If the second week comes in with repeat sales on target but new-customer sales 20 percent short, the owner looks at the ads before anything else. If the early-access email underdelivers instead, the fix is another send to the people who did not open it, not more ad money.
Now look at the percentage. At $65,000 of ads on about $656,000 of likely sales, this store is spending about 10 percent of sales on ads. That happens to be close to the rule of thumb. But it got there by spending 8.6 percent of sales in February and almost 11 percent in December, which no flat rule would ever have told it to do.
A Flat Monthly Ad Budget Overpays February and Starves December
The whole method fits in one paragraph. Split last year into repeat and new-customer sales. Forecast repeat sales first, because they are the part you can predict. Write down last year's promotions and next year's, and give each one a dollar value. Give every month its own ad budget based on what the next dollar brought back last year, measured against your own break-even line. Write down a bad year, a likely year and a great year, and plan cash on the likely one. Then check it every week and fix misses while the month is still open.
None of this needs a planning department. It needs a spreadsheet, your Shopify reports, an afternoon and the discipline to look at it every week.
Building this plan is a lot of what we do with the online stores we work with: working out what each month can carry, splitting the budget between Google and Meta, and checking it every week once the year starts. If you would rather have someone build it with you, we are happy to take a look. And if you would rather do it yourself, you now have every step.