
Here is an ad account that looks healthy. Leads come in at forty-five dollars, which is under the target you agreed on. The phone rings every day. The calendar is full three weeks out. You hired a second technician in the spring and you are thinking about a third.
And at the end of the year there is less money in the business than there was at the start.
That gap is not an ad problem in the way most people mean it. The ads did exactly what you asked. You asked for leads at forty-five dollars, and you got them. What nobody asked was which of those leads turned into customers you actually make money on, because the ad platform cannot see that, and most owners have never worked it out either.
So here is the short answer, before the long one. Some of your customers are quietly losing you money once you count the time they take. Your ads cannot tell them apart from the good ones, so they keep buying more of whatever is cheapest to get. The fix is to find out which customers carry your profit, then show the ad platforms that profile instead of letting them guess.
Your Best 20% of Customers Earn More Than All of Your Profit
Most owners have heard of the 80/20 rule: a fifth of your customers bring in most of your revenue. When researchers looked at profit instead of revenue, the picture got stranger.
Robert Kaplan, one of the accounting professors who developed activity-based costing, and his colleague V.G. Narayanan published the pattern in 2001. When a company works out what each customer actually costs to serve and ranks them from most to least profitable, the running total of profit usually looks like this:
- The most profitable 20% of customers produce somewhere between 150% and 300% of the company's total profit.
- The middle 60% to 70% roughly break even.
- The least profitable 10% to 20% lose between 50% and 200% of total profit, dragging the total back down to the 100% you actually see.
Read the first line again. The best customers earn more than all the profit the business makes. The business is only as profitable as it is because a group at the bottom is giving a large share of that money back.
Accountants call this the whale curve, because the chart rises, humps and comes back down like a whale's back. It shows up in manufacturers, banks, distributors and service firms. Gary Kunkle, a researcher who has spent years studying which small and midsize companies keep growing, describes the same split when he works with owners: a small group carrying almost all of the operating profit, a big middle that is close to the line, and a tail the business is paying to serve.
None of this means your business is badly run. It means revenue is the wrong number to sort customers by, and almost every report you look at, including every ad report, sorts by revenue or by count.
The Invoice Shows the Price. It Doesn't Show the Callbacks.
Two customers each pay you four hundred dollars. On your books they look identical. In real life, one of them took an hour and the other one took most of a day.
The difference lives in costs that never appear on the invoice. For a service business, these are the usual suspects:
- The quote that went nowhere twice before it went somewhere. Two site visits and a long phone call before a yes is real labor, and it attaches to that customer.
- Drive time. A job forty minutes away costs you eighty minutes of a paid technician and a truck before anyone picks up a tool.
- Callbacks and rework. The job you go back to fix for free was priced as if you would only go once.
- Special requests. The customer who needs a specific window, a specific technician, or a part you do not stock.
- Hand-holding. Three calls to the office to confirm the appointment, ask about the invoice, then ask again.
- Slow pay. Every reminder, every follow-up and every month you carry the balance has a cost.
Stores have their own versions: the small order that costs the same to pick, pack and ship as a large one, the customer who returns a third of what they buy, and the shopper who only ever buys on a discount code.
There is one more cost that hides all the others. If you are not paying yourself a real wage for the hours you work in the business, every one of these customers looks more profitable than it is. The hosts of the Home Service Millionaire podcast make this point bluntly in a long episode on profit: a business that shows 22% profit while the owner works unpaid is not a 22% business. Your hours are a cost. Count them, or the numbers will flatter every customer equally and you will never see the tail.
Last Year's Invoices Already Show Which Customers Make You Money
You do not need activity-based costing software or an analyst. You need a year of jobs or orders and an honest afternoon.
Start with the last twelve months. Export every job or order from your field software, your invoicing tool or your store platform. For each one you want the revenue, the direct cost (parts, materials, product, shipping), and the hours it took.
Put a real price on an hour. Take what a technician actually costs you per hour once you add payroll taxes, the truck, fuel and insurance, not just the wage. Do the same for office time. If you do the work yourself, use what you would pay someone else to do it.
Add the time the invoice never saw. Drive time, quote visits, callbacks, extra calls. If you do not track these precisely, estimate them. Kunkle's advice to owners is to start with estimates and tighten them over time, because a rough number you act on beats a perfect number you never build.
Then divide what is left by the hours. Profit per labor hour is the number that sorts customers fairly, because it puts the one-hour job and the all-day job on the same scale. If the same customers buy from you again and again, add up what each one left you across the whole year rather than job by job. Just remember that profit spread over a customer's lifetime arrives slowly, a point we made in Lifetime Value Does Not Pay This Month's Invoice.
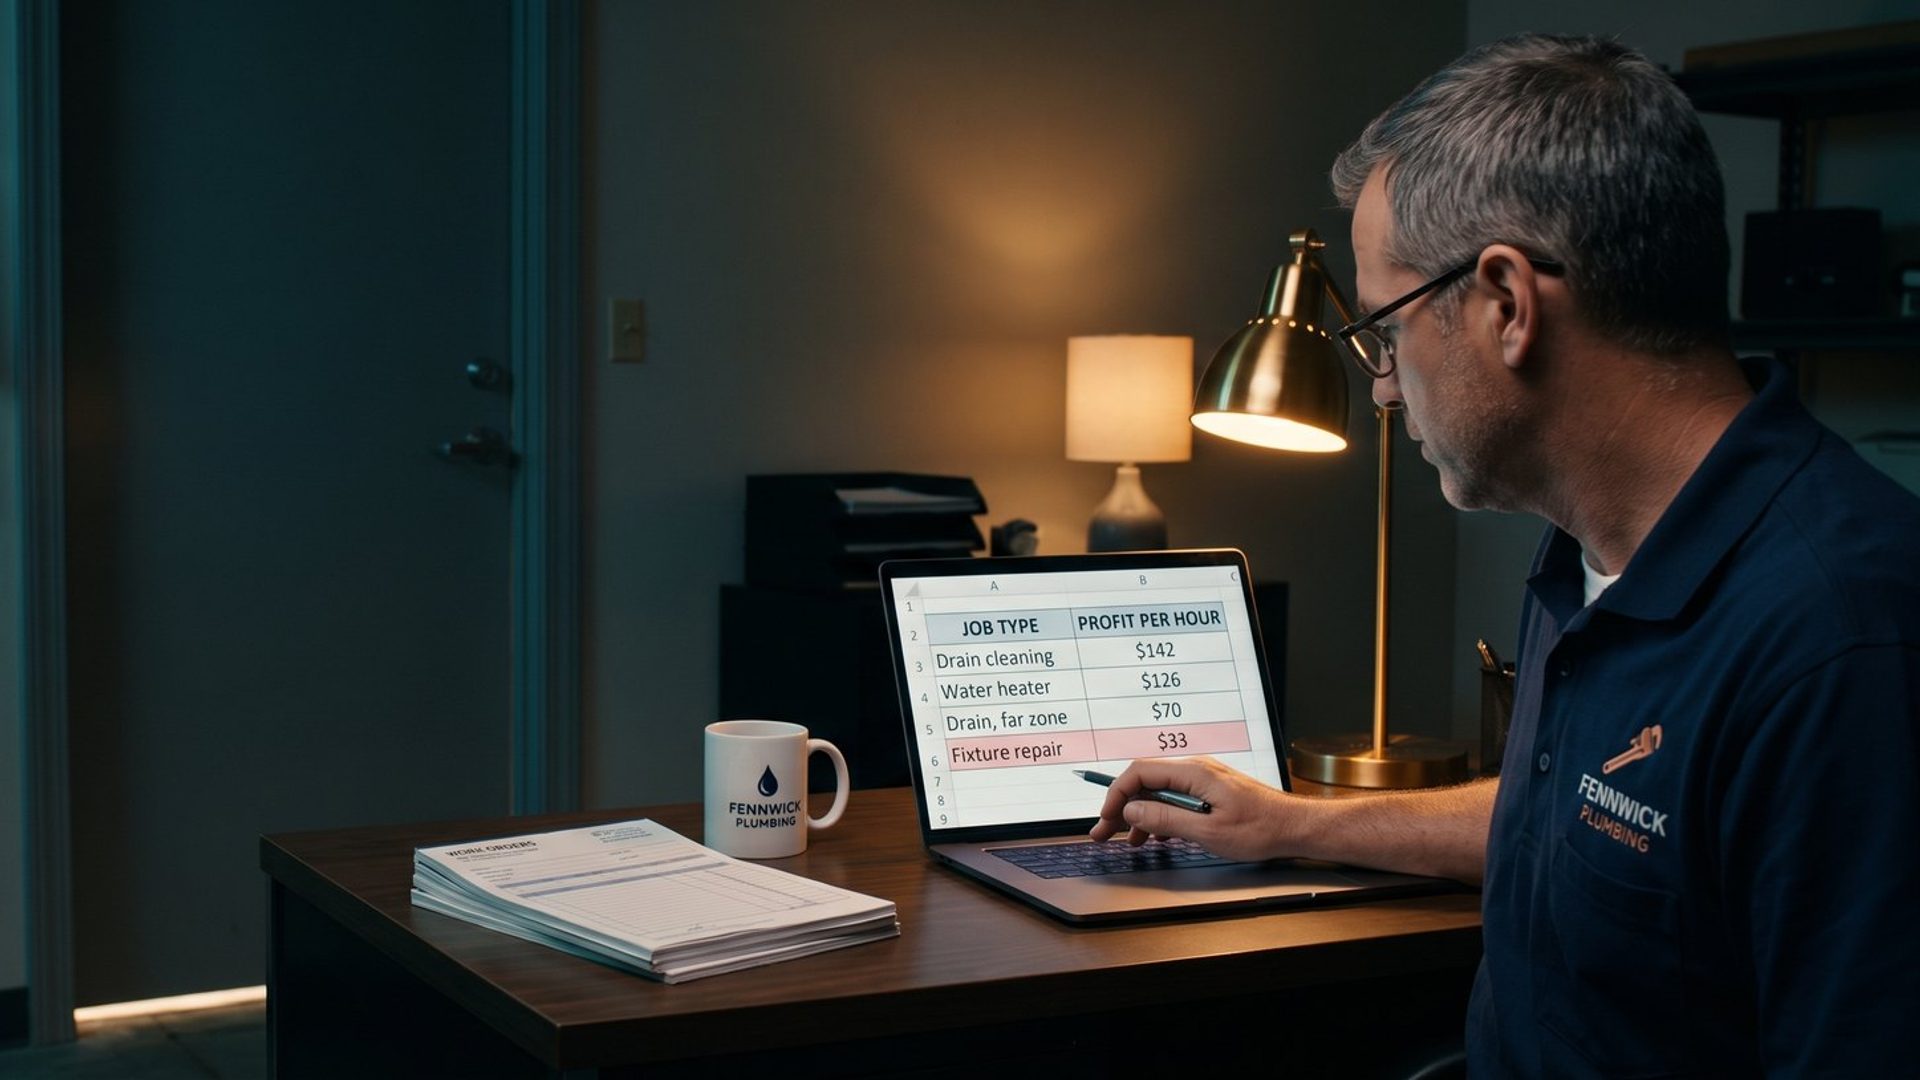
Here is how that looks for a made-up plumbing company. The numbers are invented to show the method, not taken from a client. Assume a technician costs $65 an hour all in, and office time costs $35.
- Drain cleaning, inside 20 minutes. A $325 ticket, $15 in parts and 1.5 hours including the drive. That leaves $212, or $142 per labor hour.
- Water heater replacement. A $2,100 ticket, $1,050 in equipment and parts, and 5.5 hours including the quote visit. That leaves $692, or $126 per labor hour.
- Drain cleaning, 40+ minutes out. The same $325 ticket and $15 in parts, but 2.3 hours once the drive is counted. That leaves $160, or $70 per labor hour.
- Small fixture repair. A $185 ticket, $20 in parts, 1.5 technician hours and half an hour of office calls. That leaves $50, or $33 per technician hour.
Now lay the ads over it. Fixture repairs are the cheapest leads in the account, maybe thirty dollars each, and there are plenty of them, because "leaky faucet repair" is a common search. After the ad cost, the average fixture job leaves almost nothing. The drain cleanings close by are the best work in the business, and they cost about the same to win.
The last step is the one that connects this to marketing. Group your results by things an ad platform can actually see: the service, the job size, the area, the search or ad that brought them in, and whether it was a call or a form. "Mrs. Lopez is difficult" is true and useless to Google. "Fixture repairs in the north zip codes lose money" is something you can act on in your account this week.
If you run more than one location, you will want to do this by location too, for the reasons in Your Best Market Is Paying for Your Worst One. The average hides the spread, and the spread is the whole point.
The Jobs You Win Fastest Are the Ones You Priced Too Low
Here is the uncomfortable pattern this exercise turns up more often than any other. The work you win most easily is frequently the work you are undercharging for.
That should not be surprising. If your price is below what the job is worth, people say yes quickly, they tell their neighbors, and the ads convert well. Every signal you watch says this is your best segment.
Jonathan Hill, who built the lawn care company City Turf, tells exactly this story on the Home Service Millionaire podcast. From the first week, his company tracked revenue per man-hour on every property. Years in, the data showed that the area they had come to dominate, where they now serve a large share of the homes, was their single worst-priced market. The lots there were bigger than average, and the pricing model had never caught up. Their most profitable lawns were a size smaller. They were winning the neighborhood because they were cheap in it.
What he credits the data for is confidence. Without the per-hour numbers, raising prices on your most loyal area feels reckless. With them in front of you, it is just arithmetic.
Ads make this worse, not better, because ad platforms find the path of least resistance. A segment that converts easily gets more of the budget, so the underpriced work grows fastest. A good cost per lead can be a symptom.
Ad Platforms Can't See Profit Until You Show It
Google and Meta optimize toward whatever you tell them a success is. If every lead counts the same, they will buy you the cheapest leads available, and from the table above you already know which ones those are. The work now is to put what you learned into the account, in the places the platforms actually read.
Give unequal work unequal value. A conversion does not have to be worth the same amount every time. Google lets you pass a value with each conversion, and if you track customers in a CRM or field service tool, you can import what each lead turned into, including whether it booked and what the job was worth. Even without an import, you can set different values for different conversion actions, so a water heater quote counts for more than a faucet call. The lead was never the product; the booked job is, as we argued in Nobody Buys a Roof Twice. Once values reflect profit rather than volume, bid strategies built around conversion value have something real to aim at. If your agency has never asked you for these numbers, Your Agency Cannot Give You What You Never Gave Them is about exactly that gap.
Treat areas differently, with the right tool. If a set of zip codes loses money on drive time alone, exclude them, or narrow the radius. Do not reach for location bid adjustments if you use Smart Bidding. Google's own help page says those strategies set bids automatically, and that a manual bid adjustment on them "won't be supported." The tool built for this is conversion value rules, which let you raise or lower the value of a conversion based on the person's location, device or audience. Mark a lead from the far zone as worth less, and Smart Bidding bids accordingly.
Separate the services that carry different margins. When a cheap, low-margin service and an expensive, high-margin one share a campaign, they share one target, and the budget drifts to whichever converts cheapest. We walked through that trap in You Organized Your Google Ads Account. You Starved It., including why you should not then split everything into tiny campaigns.
Upload your profitable customers, not all of them. A customer list tells Google and Meta who your buyers are. If you upload everyone who ever paid you, you are describing the whole whale curve, tail included. Build the list from the customers at the top of your sort. On Meta, that list is a much better seed for a lookalike audience than your full file. On Google, the list works as information about who converts and who to exclude from new-customer offers; how that works, and what it takes to qualify, is in Your Customer List Is the Best Audience You Can Give Google Ads.
Write ads for the customer you want. The words in your ad and the offer behind it choose who calls. Lead with the work you make money on, name your service area, and if a minimum or a starting price would screen out the jobs that lose money, say it in the ad. Putting the price in the ad is a move we covered in Most Google Ads Advice Wasn't Written for a Local Business. And be careful with discounts: a coupon tends to attract the customers who only come back for the next coupon, and those are already sitting in your tail.
Unprofitable Customers Need a New Price Before You Say Goodbye
The obvious next thought is to fire the bottom of the list. Usually that is the second move, not the first.
Most customers in the tail are not bad customers. They are customers on the wrong price or the wrong terms. Fix that first:
- A minimum charge or a trip fee for small jobs, so the half-hour repair stops costing you a ninety-minute round trip for free.
- A distance charge for the zip codes outside your best area.
- A small-order fee or free-shipping threshold for stores, so a tiny order pays for its own box.
- A rush or after-hours rate for the customer who always needs it tomorrow.
- Payment terms that end the slow-pay cycle, such as a card on file or payment due on completion.
Go back to the fixture repair in the example. At $185 it leaves about $50. Add a $50 minimum service charge and the same job leaves about $100. You could lose half of those customers and make the same money from them, with half the hours freed up for drain work that earns $142 an hour. You will not lose half. Test it first: raise the price on one in ten of the jobs that lose money, watch what happens for a month, then roll it out.
Some customers will leave. Let them. A customer who costs you money to serve is one whose departure makes you richer. And if your instinct runs the other way, toward cutting prices to win more work, read Before You Cut Your Price, Call the Last Three People Who Said Yes first.
But count only the costs that actually go away. This is where whale curve analysis misleads people, and it is the most important caution in this whole article. When you spread rent, software and the office manager's salary across every customer, small customers can look unprofitable on paper. Drop them and the rent stays the same. The only costs that leave with a customer are the ones that customer actually caused: parts, materials, the technician's time, the drive, the extra calls.
Even the technician's time only counts if you would fill it with better work. In a busy month, a money-losing job pushes a profitable one onto next week, so it really is costing you. In a slow month, the same job may be the thing paying for a truck that would otherwise sit in the lot. The question is never just "does this customer lose money?" It is "what would that hour be doing instead?"
Growth Means More of Your Most Profitable Customer, Not More Customers
Once you know who sits at the top of your list, the growth question gets simpler.
Kunkle's research is about the small slice of companies that keep growing year after year, and one of the things he says separates them is what they do with this knowledge. They work out the profile of their high-value, high-margin customers, then go find more of exactly that customer, either by winning more of them in markets they already serve or by entering new areas where that same customer lives. What they do not do is treat every potential buyer in a market as their market. If only a tenth of a market looks like your best customer, he argues, that tenth is your whole market, and chasing the rest is how you end up competing on price.
For your advertising, that changes three decisions:
- Who you target. Your ads, your keywords and your customer lists describe the top of the curve, not the average customer.
- Where you expand. The next town or service area should be chosen by where more of your profitable customers live, not by where the map has a gap.
- What you promote next. The next service you put money behind should be the one that earns the most per hour, not the one with the cheapest leads.
He adds one warning that matters if your ads are working well. Companies that add capacity all at once, usually with borrowed money, run a much higher risk of failing than companies that grow in steady steps. The steady growers in his research grew about 125% over five years, step by step, not in one leap. If profitable customers start arriving faster than you can serve them, add trucks and people as the work proves out, not ahead of it.
Your Ad Budget Belongs to the Top of Your Customer List
Pull the twelve months. Put a real price on an hour. Rank your jobs or orders by profit per labor hour and group them by service, area and source. Then look at your ad account and ask a plain question: is the money going to the top of that list, or the bottom?
For most owners who do this the first time, the answer is a little of both, and the fixes are not dramatic. A price change on one service. A few excluded zip codes. Different conversion values. A cleaner customer list. Small changes, aimed at the customers who were carrying the business all along.
We do this work with small businesses every week, starting from their own numbers rather than a template. If you would rather hand it off, we are happy to help. If you would rather do it yourself, everything you need to start is above.