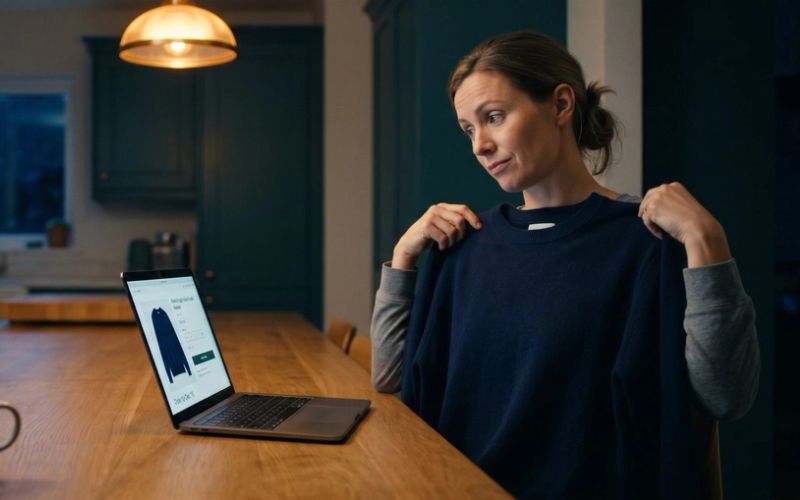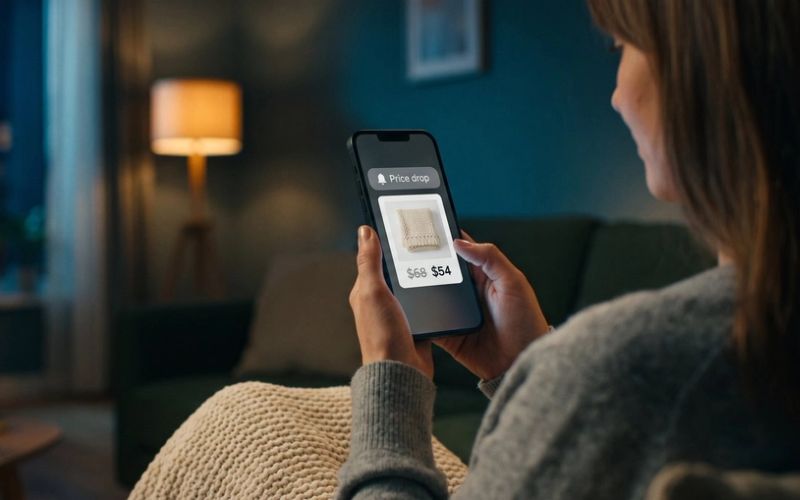
A customer buys a $68 candle set from your store on a Tuesday night. By Wednesday morning, Meta says its ad drove the sale. Google Ads says a Shopping click did. Google Analytics files it under Direct, which is its way of saying it has no idea. Your abandoned-cart email takes a bow too, because she opened it an hour before she bought.
Four dashboards, one order, and every one of them is sure. Then the customer would tell you, if anyone asked, that her sister mentioned the candles on a podcast she listens to, and she typed your store name in herself.
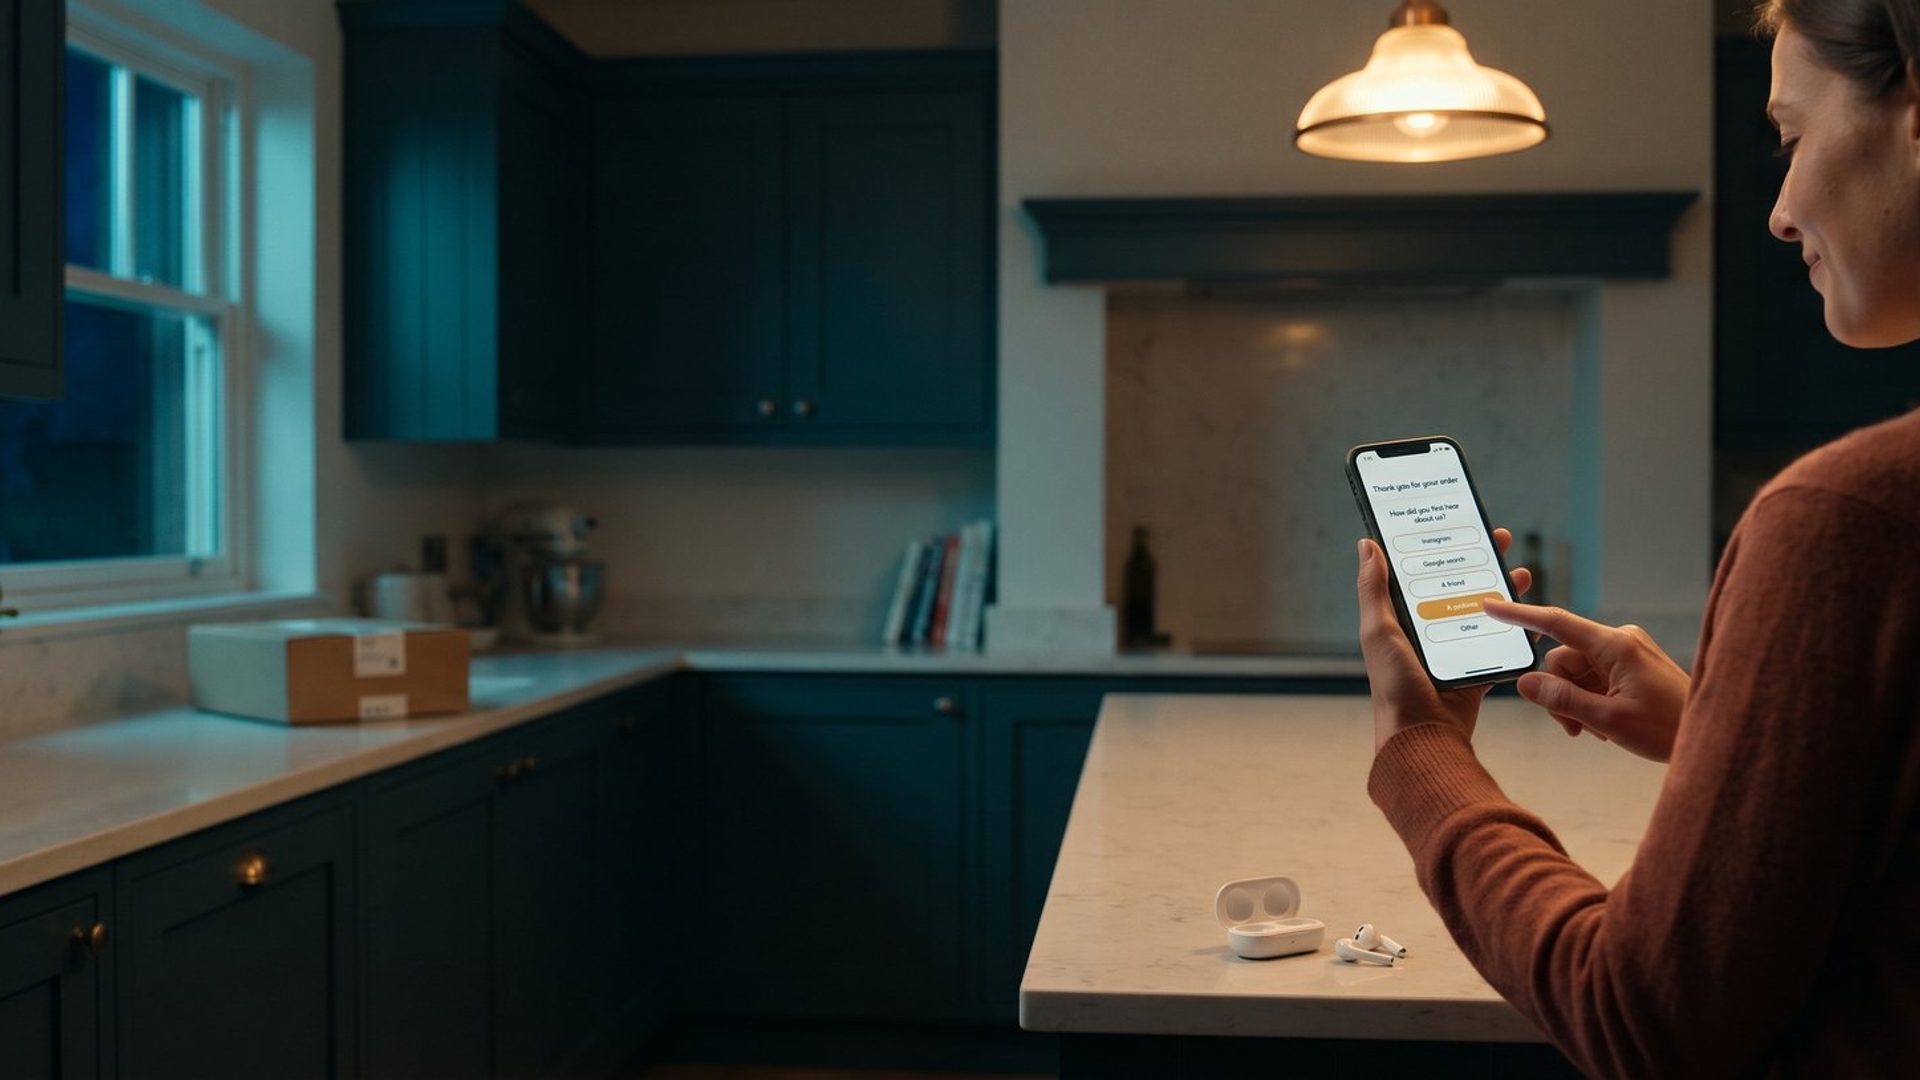
That last answer is the only one in the room that came from the person who actually made the decision. It is also the only one most stores never collect. One question on your thank-you page, "How did you first hear about us?", collects it on every order, often for nothing at small-store volume, and it is the one piece of your measurement that no browser setting, privacy update or AI shopping app can switch off.
Meta, Google Ads and Your Analytics All Claim the Same Sale. None of Them Asked the Buyer.
Every ad platform counts sales the same basic way. It watches for a click or a view, waits for a purchase from the same person, and claims the credit if it can connect the two. Each one does that on its own, with its own rules and its own window, and none of them checks with the others. That is why the numbers in your Meta account, your Google Ads account and Google Analytics never add up to your actual Shopify revenue. They routinely add up to more.
This fall, the counting is shifting under your feet in several directions at once:
- Meta switches on a new setting on November 12 that can credit more sales to your ads on sites where shoppers log in. We wrote up what Meta's November 12 Pixel change does and who it touches. Your Meta numbers may rise in Black Friday week without a single extra customer.
- An October audit in Search Engine Journal found Google Analytics recording barely a third of one retailer's holiday orders, down from nearly all of them a year earlier. We showed how to check your own store against Shopify's order count.
- Shopify now lets AI assistants sell your products and take payment inside the chat, and those orders never reach your analytics or your ad pixels.
- When ChatGPT sends a shopper to your site with a link, it often strips the information that says where the visit came from. Practical Ecommerce reported in October that Google Analytics files much of that traffic as Direct or Unassigned.
None of these is a scandal. Each is a measuring tool doing its best with less to work with. But they all point the same way: the click trail is getting thinner every year, and the platforms that grade their own homework are the ones filling in the gaps.
The Buyer Remembers the Podcast. No Pixel Was Listening.
A pixel can only see what happens in a browser. A huge share of why people buy happens somewhere else: a friend at dinner, a creator's video watched on a TV, a podcast in the car, a gift that arrived at someone's door, an answer from ChatGPT, your product on a shelf at a local shop. None of those leave a click behind. Your customer remembers them anyway.
This matters for more than tidy reporting, because the platforms are very good at standing next to demand they did not create. Say a podcast host mentions your store. A listener searches your name on Google, browses, and leaves. Meta now recognizes a fresh visitor to your site and shows her an ad. She buys a week later. Meta reports a sale. Google reports a branded-search click. The podcast, which did the actual work, gets nothing, and the next time you review your budget, it looks like the thing to cut.
Matt Bahr, who co-founded the survey company Fairing, has told the story of how the idea started. A handbag brand he advised could see in Google Analytics that nearly every sale arrived as a search for its own name, an unpaid search result or a Direct visit, and could not explain where those people were coming from. They put a plain Google Form on the order confirmation page, and within a month customers were naming an influencer nobody on the team had heard of.
A Store That Only Runs Meta and Google Ads Learns the Least From This Survey
Here is the part the survey apps say quietly, and to Bahr's credit, he has said it out loud: if a store advertises only on Meta and Google and does nothing else to create demand, a post-purchase survey adds the least. Those two platforms track their own clicks reasonably well. The survey earns its keep when some of your demand comes from places that cannot be tracked at all, which for most small online stores is a bigger share than they think. Word of mouth, gifting, local press, a market stand on Saturdays and a creator who posted about you unpaid all count.
So be honest about which store you are. If you are spending on podcasts, creators, influencer gifting, a local event or anything offline, or if you have reason to think word of mouth carries you, put the question up this week. If every order really does start with a paid click, the survey will mostly confirm what your dashboards say. That is still worth knowing, but it is a lower priority than fixing your checkout or your margins.
The Thank-You Page Gets Answered. The Follow-Up Email Mostly Doesn't.
On Shopify, the thank-you page is the right place for this question, and it is available on every plan. Shopify's own help pages say apps that add blocks to the Thank you and Order status pages work on Basic and up, while apps that change the information, shipping and payment steps of checkout are Shopify Plus only. That restriction works in your favor. Asking before the customer pays risks the sale. Asking after costs you nothing.
Install a survey app from the Shopify App Store (Fairing, KnoCommerce and Zigpoll are three that do this), then add its block to the Thank you page in the checkout and accounts editor. Setup takes a few minutes. Fairing and Zigpoll both list a free plan on the Shopify App Store, which is enough to start; paid tiers add reporting and integrations you can grow into.
Response rates are the reason the thank-you page wins. Fairing, which runs these surveys for thousands of stores, puts its average at about 45% of orders, with most stores between 40% and 60%. A survey emailed a few days later is lucky to get a fraction of that, because the customer has moved on. Treat those figures as the vendor's own numbers; nobody independent audits them. Even at half that rate, the thank-you page beats any follow-up email.
Three things pull the thank-you page response rate down, by Fairing's account:
- Clutter. Every app wants that page: a referral offer, an upsell, a "share on Instagram" box. Fairing says stores with several competing widgets drop to 25-30%. Put the question first and keep the page quiet.
- A slow page. If the confirmation page takes an extra second to load, a chunk of customers are gone before the question appears.
- A reward for answering. It feels generous. It wrecks the data, because people pick whichever option gets them the code fastest. Do not pay for answers.
"How Did You Hear About Us?" Gets You "The Internet." Unless You Write the Options.
A blank text box gets you the most accurate answers per person and the fewest answers overall. Most people will not type. A badly built list gets you lots of answers that mean nothing. "Social media" tells you nothing about whether to spend on Meta. "Online" is not a channel.
The fix is a short, specific list built around how a customer remembers finding you, not around how your ad accounts are organized. Ask "How did you first hear about us?" and offer something like this, adjusted to your store:
- Instagram or Facebook
- Google search
- YouTube
- A podcast
- A friend or family member
- Received it as a gift
- An AI assistant like ChatGPT
- Saw it in a store or at an event
- Other (with a box to type in)
Seven to ten options is plenty. Bahr has described dropping one large brand's list from 15 options to seven without any change in how many people answered, so a long list buys you nothing. A few rules that keep the answers honest:
- Shuffle the order, except Other, which stays last. People pick the top option more often than they should.
- Ask first-time buyers only. A customer on their fifth order cannot remember how they found you three years ago, and their answer muddies the newcomers.
- Always keep Other with a box. That box is where you find out what you did not know to ask about.
- Watch for a channel you never listed. When you start something new, like a podcast sponsorship, leave it off the list for the first few weeks and see whether customers type it in on their own. Unprompted write-ins are a stronger signal than clicks on an option you handed them.
If your product is a big, considered purchase, such as furniture, a mattress or anything people research for weeks, swap the question for "What made you decide to buy today?" The first touch may have been a year ago and long forgotten. What tipped them this week is the more useful answer.
Fifty Survey Answers Is a Rumor. You Need About 350.
This is where small stores go wrong, and it is the part the survey app dashboards will not warn you about. The chart looks authoritative from the first day. It is not.
Say 20% of your first 50 answers name a podcast. With only 50 answers, ordinary chance means the real figure could plausibly sit anywhere from about 9% to 31%. That is the difference between a channel that is quietly carrying you and one that barely registers. At 350 answers, the same 20% narrows to roughly 16% to 24%, which is a number you can make a decision on. Fairing gives the same guidance: let a question run to about 350 responses before trusting the split.
Now the arithmetic that matters for a small store. If you ask only first-time buyers and about 45% answer, 350 answers takes about 780 first orders.
- 100 new customers a month: about eight months.
- 200 new customers a month: about four months.
- 400 new customers a month: about two months.
- 800 new customers a month: about one month.
That is not a reason to skip it. It is a reason to start now and to stop yourself from moving budget off two weeks of answers. Look at the results monthly, but make channel decisions on the running total, not the latest week.
Your Survey and Your Ads Dashboard Will Disagree. The Gap Is the Finding.
Once you have a real sample, put two numbers side by side for each channel: the share of first-time buyers who named it, and the share of new-customer sales that channel's own reporting claims. You will not get a match, and you are not supposed to. The survey measures what the customer remembers. The dashboard measures what the platform could connect. The interesting part is where they disagree, and the disagreements come in three shapes.
Customers name it, the platform barely credits it. This is the podcast, the creator, the gift, the friend. If a channel keeps showing up in the answers and looks weak in the reports, do not cut it on the strength of the reports. It is probably doing more than anything can track.
The platform claims it, customers rarely name it. This is usually retargeting and branded search: ads that reach people who were already on their way to you. They are not worthless, since reminding a warm shopper has value, but they are probably getting credit for demand something else created. Do not switch them off on a hunch. Test it. For Meta, that means a real holdout, and we covered when Meta's own incrementality test is worth trusting.
The two roughly agree. Good news. Your reporting for that channel is close enough to trust, and you can manage it from the dashboard with more confidence.
Two cautions keep this honest. First, the answers are directional, not exact. People misremember, and they tend to name the thing that made the strongest impression rather than strictly the first. That is arguably what you want to fund anyway. Second, a channel your customers love can still lose money. Once you know which channels are really bringing in buyers, run them through the margin math in why a 3x return can still lose money. The survey tells you where customers come from. It does not tell you what they cost.
The Write-In Box Is Where ChatGPT Shows Up
Read the Other answers every week. It takes five minutes and it is the most interesting five minutes in your reporting. This is where you will see "my sister," a named podcast, a local shop that stocks you, a creator you never paid, and, increasingly, "ChatGPT said you were the best one."
That last one is worth watching closely right now. AI assistants are becoming a real way people shop, and the clicks they send mostly arrive looking like Direct traffic. One honest caveat: orders a shopper completes entirely inside a chat app never reach your thank-you page, so the survey cannot catch those. But shoppers who ask an AI for a recommendation and then come to your site to buy will tell you, if you have given them an option to pick. Without the question, you would have no idea it was happening.
Two other uses fall straight out of the same data:
- Track word of mouth over time. The share of new customers who name a friend or family member is one of the best health checks a small brand has. If it climbs, people are recommending you. If it slides after a product change or a rough shipping season, you will see it here before you see it in reviews. If it is high, that is also the case for a referral program that pays for word of mouth you already have.
- Save the answer to the customer record. Most survey apps can pass answers into Klaviyo or your email tool, so a customer who came from a podcast can get a welcome message that mentions it.
November Fills Your Survey Faster Than Any Other Month
For many online stores, the next seven weeks bring more first-time buyers than any other stretch of the year. That makes this the cheapest time to build your sample. A store that needs four months to reach 350 answers at normal volume may get there by mid-January if the question is live before Black Friday.
Here is the whole setup:
- Install a post-purchase survey app and add its block to your Thank you page.
- Ask one question, "How did you first hear about us?", with seven to ten specific options, shuffled, plus Other with a box.
- Show it to first-time buyers only. Offer nothing for answering.
- Keep the rest of the thank-you page quiet so the question is the first thing people see.
- Read the write-ins weekly. Make no budget decisions until you have about 350 answers.
- Then lay the answer shares next to what each ad platform reports, and act on the gaps: protect what customers name, test what only the dashboards claim.
Every other number in your reporting is a machine's guess about what your customer did. This one is your customer telling you. When we set up and manage ads for online stores, a survey like this is one of the first things we'd want in place, because it keeps the platforms honest about what they are really doing. If you would like help reading yours, we are glad to take a look. And if you would rather do it yourself, the question takes ten minutes to put up. Put it up before the busiest week of your year.